What makes 7050 aluminum alloy a standout material in high-strength applications? This blog post explores its unique composition, including zinc, magnesium, copper, and zirconium, which enhance its strength and resistance to cracking. You’ll discover how specific heat treatment processes influence its electrical conductivity and mechanical properties, making it suitable for aerospace and other demanding industries. Learn how adjusting these treatments can optimize both performance and durability in real-world applications.
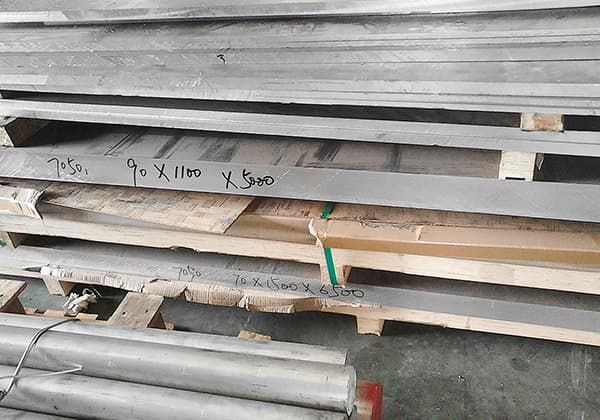
7050 aluminum alloy is one kind of Al-Zn-Mg-Cu alloy developed by Alcoa Corporation in the 1970s through regulating the component of 7075 aluminum alloy.
Zn and Mg in 7050 aluminum alloy can form a strong aging effect of MgZn2 phase, which is the main strengthening phase of high-strength aluminum alloy, significantly improving the strength of 7050 aluminum alloy.
Cu can reduce the potential difference between grain boundaries and intracrystalline regions, suppress its susceptibility to intergranular cracking, and expand the stable temperature range of G.P. zones, making the alloy less prone to over-aging.
Zr has a good effect on increasing the recrystallization temperature and refining the grain size of the alloy, and it can maintain the stability of Zn, Mg, and Cu in the solid solution, significantly reducing the quenching sensitivity of 7050 aluminum alloy.
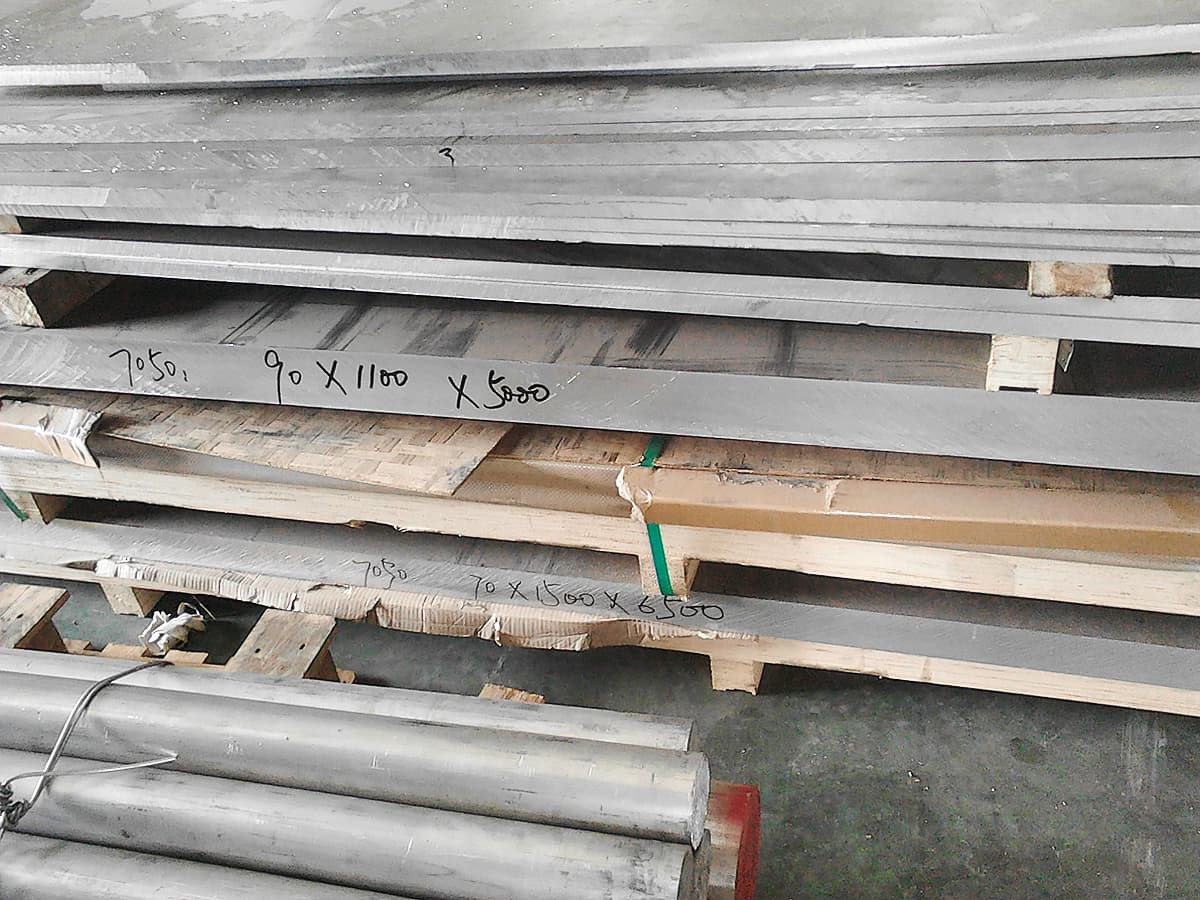
Currently, it is difficult to achieve a stable technical level of material properties after heat treatment for 7050 aluminum alloy material, and there are often cases of non-compliant electrical conductivity in actual production.
The electrical conductivity cannot be matched with strength and stress corrosion sensitivity factors.
Therefore, it is very meaningful to find the influencing factors of heat treatment process on electrical conductivity, and to match the electrical conductivity of forged pieces with other properties.
(1) In this article, 7050 aluminum alloy square material was used, and its standardized chemical composition is shown in Table 1.
Table 1 Chemical composition (mass fraction, %) of 7050 aluminum alloy.
| Alloy | 7050 |
| Al | remaining |
| Zn | 5.7~6.7 |
| Cu | 2.0~2.6 |
| Mg | 1.9~2.6 |
| Si | <0.12 |
| Zr | 0.08~0.15 |
| Ti | <0.06 |
| Fe | <0.15 |
| Mn | <0.10 |
| Cr | <0.04 |
| Other | <0.15 |
(2) Forging dimensions. The forging dimensions and effective thickness are shown in Table 2.
Table 2 Forging dimensions and effective thickness.
| Forging size | Effective thickness of forgings |
| 550mm×295mm×174mm | 174mm |
(3) The heat treatment system is shown in Table 3. The equipment accuracy used in the heat treatment process is ±3℃.
Table 3 Heat treatment system of 7050 aluminum alloy T7452.
| Heat treatment status | Forging number | Solid solution | Cold deformation | First level timeliness | Secondary timeliness |
| T7452 | A | 477℃ × 65h, water-cooled | 2%~3% | 121℃ × 6h, air-cooled | 175℃ × 8h, air-cooled |
| B | 471℃ × 65h, water-cooled | 2%~3% | 121℃ × 6h, air-cooled | 175℃ × 8h, air-cooled | |
| C | 471℃ × 6.5h, water-cooled | 2%~3% | 121℃ × 6h, air-cooled | 175℃ × 10h, air-cooled | |
| D | 471℃ × 65h, water-cooled | 2%~3% | 121℃ × 6h, air-cooled | 175℃ × 12h, air-cooled |
To investigate the above issues, based on production, four sets of experimental plans were designed. The heat treatment system of forging A and forging B changes the solution temperature, while the others remain unchanged; the heat treatment system of forging B, forging C, and forging D increases the secondary aging time by 2 hours each time, while the other parameters remain unchanged.
The influence of four heat treatment systems on the electrical conductivity of forgings.
The electrical conductivity of 7050 aluminum alloy is mainly affected by the degree of alloying, matrix recrystallization, and the precipitation of solutes in the solid solution during solution treatment and aging process.
In this study, four heat treatment systems were used to treat the forgings, and the electrical conductivity was measured at five points for each forging using an eddy-current type electrical conductivity meter, as shown in Table 4.
Table 4 Electrical conductivity/(mS/m) of four groups of forgings.
| Forging number | Test result | ||||
| Position 1 | Position 2 | Position 3 | Position 4 | Position 5 | |
| A | 23.01 | 23.16 | 23.14 | 22.95 | 22.99 |
| B | 22.66 | 22.36 | 22.56 | 22.31 | 22.28 |
| C | 23.35 | 23.32 | 23.29 | 23.42 | 23.12 |
| D | 23.5 | 23.5 | 23.8 | 23.6 | 23.6 |
During the solution treatment of aluminum alloys, two main processes occur, which are the dissolution of excess phases and the recrystallization of the matrix. These are also the main factors affecting the electrical conductivity during the solution treatment process.
The dissolution of excess phases is to dissolve solute atoms into the matrix as much as possible, forming a supersaturated solid solution, preparing for the precipitation of strengthening phase during aging process.
7050 aluminum alloy has a high content of alloying elements and a complex internal structure, with various types of eutectic phases in the alloy, such as T(AlZnMgCu), S(Al2CuMg), η(MgZn2) and Al7Cu2Fe.
According to literature reports, at a solution temperature of 471℃, some T phase partially melts into the matrix, but there is still a small amount of S phase in the matrix; when the solution temperature is 477℃, S phase can still be detected in the alloy.
Within a certain range, the degree of solid solution of the forgings increases with the increase of solution temperature.
When the solution temperature rises from 471℃ to 477℃, the deformed structure decreases and the recrystallized structure increases.
Moreover, the higher the solution temperature, the faster the percentage of alloy recrystallization increases, and the influence of recrystallization on electrical conductivity is greater than that of solute atoms being dissolved into the matrix.
Comparing the electrical conductivity of forging B and forging A, it is found that the electrical conductivity increases as the solution temperature increases from 471℃ to 477℃.
This is because the higher the solution temperature, the faster the percentage of alloy recrystallization increases, and at this time, the influence of recrystallization on the electrical conductivity of the alloy is greater than that of solute atoms being dissolved into the matrix, resulting in an increase in electrical conductivity.
Comparing the electrical conductivity of forging B, forging C, and forging D, it can be found that the electrical conductivity of the forgings increases sequentially as the secondary aging time prolongs.
This is because the aging treatment is a key heat treatment process that controls the properties of the forgings.
The precipitation sequence of 7050 aluminum alloy during the two-stage aging process is: supersaturated solid solution → G.P. zones → η’ phase → η phase.
During the secondary aging, the larger-sized G.P. zones transform to η’ phase, and with the prolongation of the secondary aging time, the content of G.P. zones decreases, the content of η’ phase increases, and at the same time, the strength decreases and the electrical conductivity increases.
The effect of four heat treatment systems on the room-temperature tensile properties of forgings.
The room-temperature tensile properties of large forgings of 7050 aluminum alloy processed by four heat treatment systems are shown in Table 5.
Table 5 Room-temperature tensile properties of forging A, forging B, forging C, and forging D.
| Forging | Tensile strength /MPa | Yield strength /MPa | Elongation /5D (%) | Specimen direction |
| A | 521 | 488 | 13.0 | L |
| 503 | 445 | 12.5 | ||
| 499 | 456 | 6.0 | LT | |
| 501 | 476 | 6.5 | ||
| 486 | 412 | 5.0 | ST | |
| 484 | 414 | 6.0 | ||
| 470/460/450 | 400/385/360 | 8/4/3 | standard | |
| B | 538 | 500 | 13.5 | L |
| 519 | 479 | 12.5 | ||
| 523 | 477 | 10.0 | LT | |
| 542 | 500 | 10.5 | ||
| 507 | 463 | 4.5 | ST | |
| 508 | 463 | 4.5 | ||
| 470/460/450 | 400/385/360 | 8/4/3 | standard | |
| C | 502 | 415 | 12.5 | L |
| 511 | 422 | 13.0 | ||
| 504 | 452 | 8.5L | LT | |
| 519 | 471 | 6.5 | ||
| 501 | 438 | 8.5S | ST | |
| 515 | 452 | 8.5 | ||
| 470/460/450 | 400/385/360 | 8/4/3 | standard | |
| D | 491 | 416 | 13.5 | L |
| 489 | 416 | 14.0 | ||
| 476 | 385 | 10.5L | LT | |
| 471 | 387 | 11.5 | ||
| 464 | 370 | 8.5 | ST | |
| 476 | 389 | seven | ||
| 470/460/450 | 400/385/360 | 8/4/3 | standard |
Comparing the room-temperature tensile data of forging A and forging B, it can be found that the strength decreases by about 20MPa as the solution temperature increases from 471℃ to 477℃.
This is because in this temperature range, the effect of recrystallization dominates, and the process of recrystallization is not entirely a process of grain refinement.
Since the aging temperature is much lower than the solution treatment temperature, the morphology and dislocation configuration of the alloy grains after solid solution treatment may change weakly during the aging process.
Therefore, if the percentage of recrystallization is high after the solid solution treatment, the dislocation density in the material will decrease, resulting in a decrease in the strength of the alloy.
Among them, the transverse yield strength of the forging B at a solution temperature of 471℃ is too high, which will affect the stress corrosion sensitivity factor of the forging (longitudinal yield strength – 12 × electrical conductivity).
Generally, if the transverse yield strength is greater than 490MPa, the stress corrosion sensitivity factor is unqualified.
Comparing the room-temperature tensile data of forging B, forging C, and forging D, it can be found that the strength of the forgings tends to decrease as the secondary aging time prolongs.
However, the strength of forging D has already been pressed to the limit, with no margin, making it easy to become unqualified. During the secondary aging process, the content of G.P. zones larger than the critical size increases, thereby forming η’ phase, and the alloy is over-aged, resulting in a decrease in the strength of the alloy.
The relationship between forging electrical conductivity, strength, and stress corrosion sensitivity factor.
Since electrical conductivity has the advantages of fast testing, non-destructive, and easy measurement, it can be used to estimate some mechanical properties of the alloy in actual production.
By summarizing the performance data of past production processes, the strength performance data corresponding to the range of electrical conductivity is summarized in Table 6.
Table 6 Summary of strength and electrical conductivity data.
| Tensile strength range /MPa | Yield strength range /MPa | Sample direction | Conductivity range /(mS/m) |
| 500~552 | 490~507 | L | 22.5~24.5 |
| 498~542 | 462~506 | LT | |
| 480~510 | 403~474 | ST | |
| 495~535 | 490~510 | L | 22.5~23.5 |
| 481~530 | 409~487 | LT | |
| 473~505 | 370~446 | ST |
From Table 6, it can be found that there is a matching relationship between the conductivity, strength, and stress corrosion sensitivity factor performance.
For forgings with high strength requirements, the conductivity of the forgings can be controlled within the range of 22.5-24.5 mS/m.
For forgings with requirements for stress corrosion factor, the conductivity should be controlled within the range of 22.5-23.5 mS/m. Both the strength and stress corrosion factors of the forgings can meet the standard requirements.
With the extension of the second-stage aging time in 7050 aluminum alloy, the η (MgZn2) equilibrium phase precipitated in the grain becomes more uniform, and the precipitation phase at the grain boundary becomes discontinuous and coarsened.
The electrochemical corrosion caused by the potential difference between the grain boundary and the matrix is reduced, thus improving the anti-peel corrosion performance of the 7050 aluminum alloy.
As the second-stage aging time increases, the conductivity also increases. Therefore, in daily production, the slightly higher conductivity can be controlled to meet the better anti-peel corrosion performance of the forgings while meeting the strength requirements.
Although the correlation between the conductivity of aluminum alloy and some of its mechanical properties has been discovered, it is still not clear what the intrinsic connection of some of these correlations is.
Therefore, a large amount of actual production data is still needed to analyze and summarize.
⑴ When the solution temperature rises from 471°C to 477°C, the strength of the forgings decreases and the conductivity increases.
⑵ With the extension of the second-stage aging time, the strength of the forgings decreases, the conductivity increases, and the anti-peel corrosion performance improves.
⑶ When the conductivity is controlled within the range of 22.5-23.5 mS/m, the requirements for both strength and stress corrosion sensitive factors of the forgings can be met simultaneously.
⑷ In actual production, the mechanical properties of forgings can be inferred by their conductivity.

