Ever noticed how slight color differences can make or break a product’s appearance? Ensuring paint color consistency across multiple parts from different suppliers is a common challenge in manufacturing. This article guides you through methods to check paint color differences, explains criteria for acceptable variations, and introduces tools like color difference meters. You’ll learn how to maintain high standards for product appearance, ensuring your final product looks as intended. Dive in to master the nuances of color consistency in production.
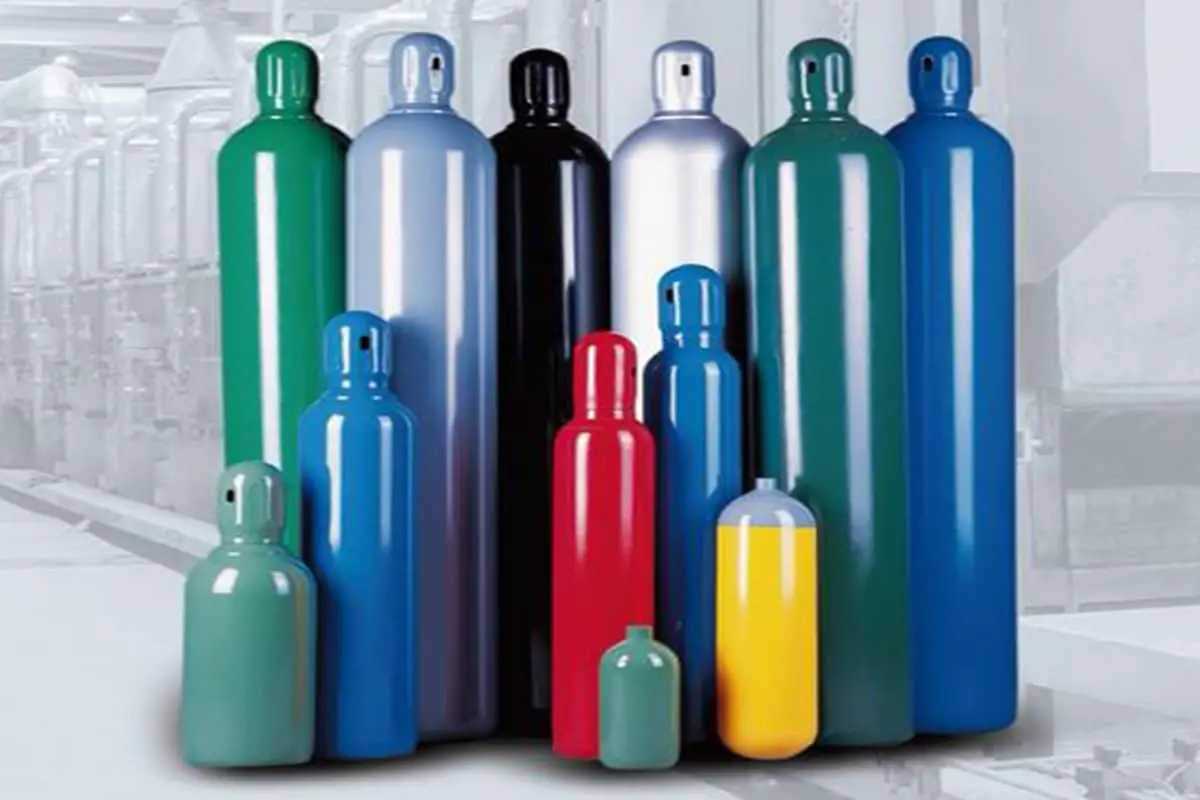
In the actual production process, when a product is composed of multiple parts and components, which are provided by multiple suppliers, and we require the overall appearance color of the product to be consistent, we will encounter the chromatic aberration problem of the product appearance paint color.
What to do after encountering the chromatic aberration problem of the product appearance paint?
How can we judge whether the product color provided by the supplier meets our requirements?
Human eyes distinguish colors according to the wavelength of visible light, and colors vary with different wavelengths (such as rainbow).
In the spectrum, most colors can be mixed with red, green and blue according to different proportions.
Therefore, the color can be represented by RGB value.
In the computer, we use bytes (1byte=8bit) to represent the color component.
When converted to decimal, one byte can represent 256 colors.
The color represented by RGB is R (0-255), G(0-255), B (0-255), and RGB can express 256 × 256 × 256 = 16777216 colors.
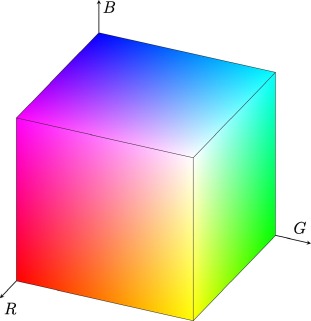
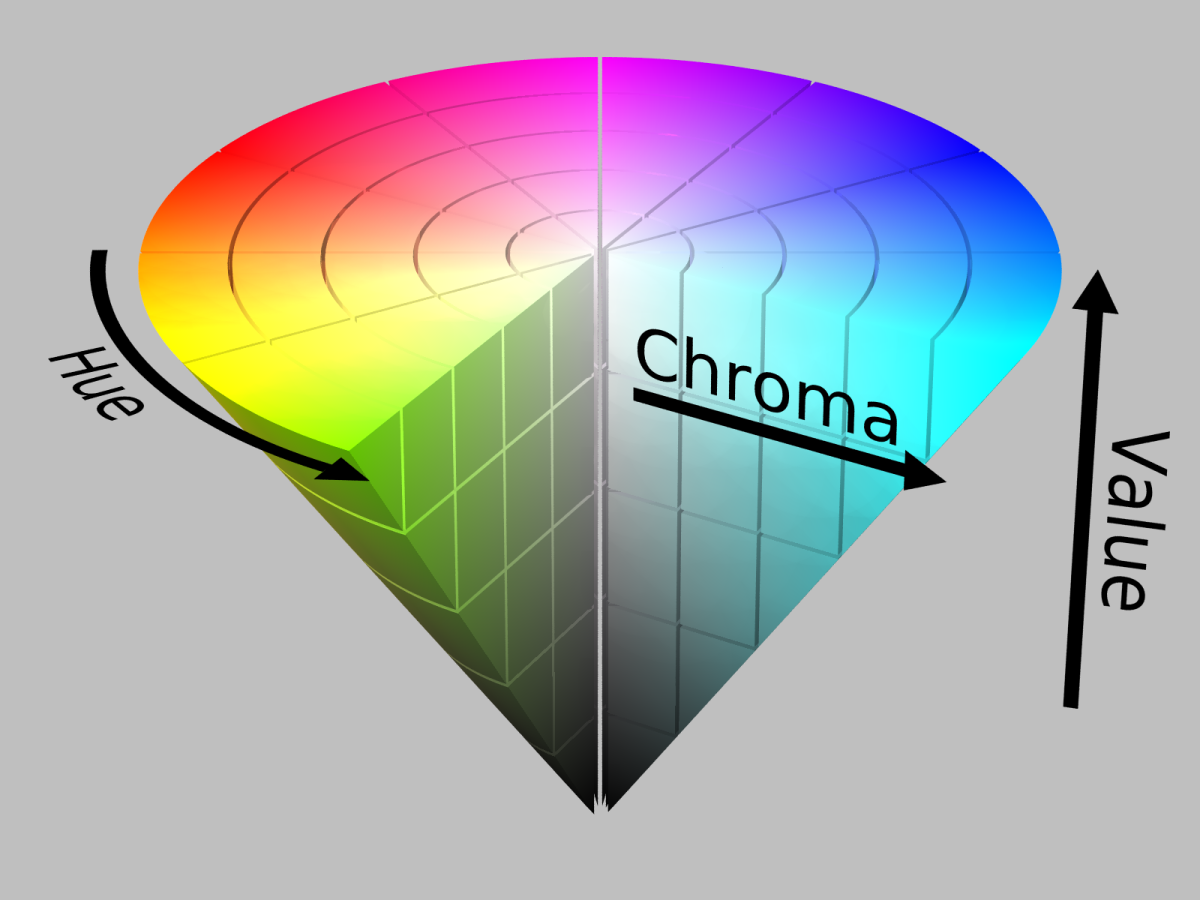
In addition to the commonly used RGB representation of color, there is also HSV color space: hue (H), saturation (S), lightness (V).
The value range of hue (H) is 0 ° ~ 360 °, and the value range of saturation (S) and lightness (V) is 0-1.
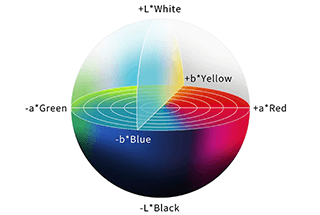
In addition to the above two color representation methods, there is also the Lab color space representation method.
Lab color space is based on the perception of color by human eyes, and can represent all colors that human eyes can feel.
Lab color space can make up for the uneven color distribution of RGB color model, and is the color representation mode covering the widest range of colors at present.

L: represents lightness and darkness (black and white), △ L Large indicates partial white, △L small indicates partial black;
a: represents red and green, △a large indicates partial red, △a small indicates partial green;
b: represents yellow and blue, △b large indicates yellowish, and △b small indicates bluish;
In addition, the Lab color space also defines the color difference valueΔE.
Color difference value is used to represent the difference of colors.

ΔE=0~0.5 extremely small difference, which can hardly be determined by naked eyes;
ΔE=0.5~1.0 small difference, which is the allowable range of general color difference;
ΔE=1.0~1.5 small difference, acceptable in specific applications;
ΔE=1.5~3.0 the difference in the degree of perception by the naked eye is acceptable in specific applications;
ΔE=3.0~6.0, quite significant difference.
In product drawings, the requirements for paint color generally use the color number of the color card provided by the manufacturer to indicate the specific color of the paint, commonly used are ral color card and Panton color card.
In the inspection of paint color, we often use standard color plates to judge whether the color can meet our requirements through sensory comparison.
When using color board comparison, we can only judge whether the colors are consistent, but we can’t feed back an accurate color difference information to the supplier.
Therefore, in order to quantify the difference between the paint color and the color we require, we need to use a color difference meter to judge.
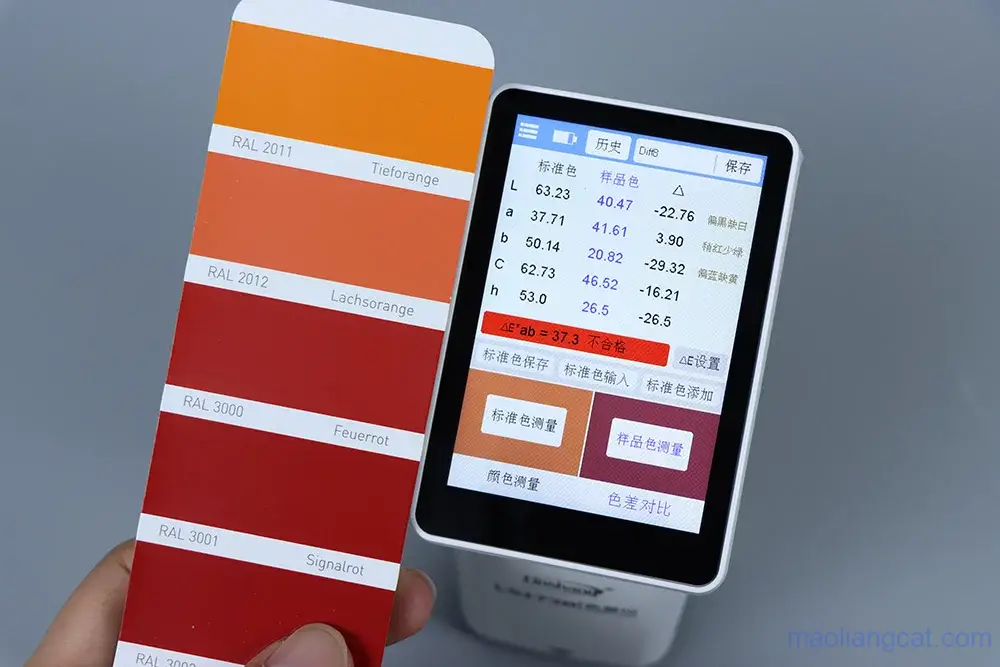
The lab value, △L, △a, △b,ΔE value of paint can be read quickly by using the color difference meter.
The following is the meaning of color difference.
For comprehensive color difference valueΔE the general acceptance requirement is less than 0.5. If the requirement is not strict, it can be relaxed appropriately ΔE.
| Chromatic aberration value | <-4 | -4~0.2 | -0.2~0.2 | 0.2~4.0 | >4.0 |
| △L | Black and white | Slightly black and less white | normal | Slightly white and slightly black | White and black |
| △a | Greenish red deficiency | Slightly green and less red | normal | Slightly red and less green | Red and green |
| △b | Bluish and yellowish | Slightly blue and less yellow | normal | Slightly yellow and less blue | Yellowish and bluish |

