Have you ever considered what makes steel truly exceptional? The purity of steel, determined by the type and quantity of non-metallic inclusions, plays a crucial role. This article delves into the methods used to assess steel purity, such as microscopic examination and statistical calculations. By reading, you’ll gain a deeper understanding of these techniques and how they impact steel quality, ensuring you can make informed decisions in your projects.

After testing and evaluating the type and grade of non-metallic inclusions in steel under a microscope and performing statistical calculations, a relatively macro level of steel purity (or index) is obtained. This purity level serves as a basis for a more comprehensive evaluation of the steel’s quality.
The purity level expressed in DIN 50 602 standard is determined by the K method.
Annex C of the ISO 4967 standard gives the formula of the relevant purity level Ci:

Where:
fi – weight factor, the weight factor of each inclusion level is as follows:
| Grade-i | 0.5 | 1 | 1.5 | 2 | 2.5 | 3 |
| weight factor-fi | 0.05 | 0.1 | 0.2 | 0.5 | 1 | 2 |
ni — number of field of view of level i;
S – total inspection area of sample, unit: mm2
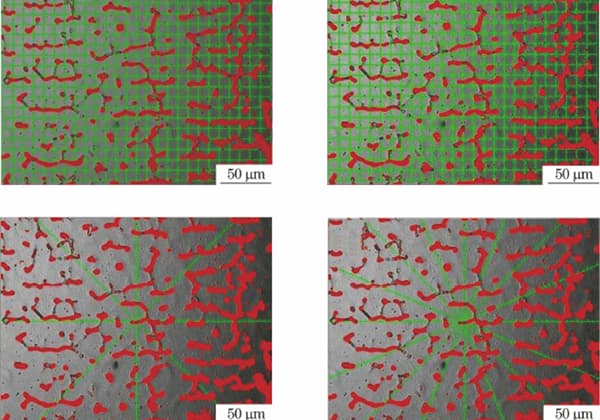
The purity is calculated by dividing the number of occupied grids by the total number of grids in a field of view.
This method is relatively objective and suitable for image processing. It is described in Appendix 1 of JIS G 0555.
The aforementioned standard specifies the purity (d%) required to detect three types of inclusions:
The specimen typically measures 15mm in width and 20mm in height, resulting in a polishing area of 300mm².
Inclusion inspection is usually carried out under a magnification of 400 times.
A glass plate with 20 vertical and horizontal grid lines is placed into the microscope eyepiece.
The surface under inspection is examined on the microscope stage, and the number of grids occupied by various inclusions is counted.
A total of 60 fields of view must be measured, with at least 30 fields of view required.
Using the number of grids on the glass plate within the field of view, the number of fields of view, and the number of grids occupied by inclusions, calculate the percentage area occupied by inclusions using the formula below to determine the cleanliness d (%) of the steel.

Where: p — total number of grids on the glass plate in the field of view;
f – number of field of view;
n — the number of cells occupied by all inclusions in f fields of view.
Recording method:
For example: dB60 × 400 = 0.08%, indicating that the content of class B inclusions is 0.08% when 60 fields of view are detected on the 300 mm2 test surface under 400 times.


