Ever wondered how to enhance the durability of steel? QPQ treatment might be the answer. This innovative process, combining nitriding and oxidation, significantly boosts the wear and corrosion resistance of 40Cr steel. In this article, you’ll discover how QPQ outperforms traditional methods like chromium plating and ion nitriding, making it a superior choice for various industrial applications. Dive in to learn about the science behind QPQ and see how it can improve the lifespan and performance of your metal components.

The technological process of QPQ treatment is:
Degreasing and cleaning → preheating → salt bath nitriding → salt bath oxidation → desalting and cleaning → drying (polishing → salt bath oxidation → desalting and cleaning → drying) → oil immersion.
The QPQ (Quench-Polish-Quench) technology is a combination of nitriding and oxidation processes. It is a salt bath treatment that enhances the wear and corrosion resistance of the substrate surface by combining nitrogen and oxidation.
This technology is often used as an alternative to carburizing and quenching, ion nitriding, and chromium plating. It improves the wear and corrosion resistance of products while reducing the risk of hardening deformation.

The QPQ technology has a wide range of applications in fields such as engineering machinery, instrumentation, and the light chemical industry. In this study, the wear and corrosion resistance of 40Cr steel were evaluated after undergoing QPQ treatment and compared to those of glow plasma nitriding, oxidation, and chromium electroplating.
The test material used in this study was 40Cr steel with a hardness of approximately 274HV after undergoing quenching and tempering. The metallographic samples were prepared through wire cutting and had dimensions of φ30mm × 10mm for wear testing and φ10mm × 100mm for corrosion resistance testing. The samples were assigned separate numbers as shown in Table 1.
Before undergoing heat treatment, the surface of the samples was ground to achieve a roughness value of 1.6μm and cleaned with anhydrous acetone, rinsed with clean water, and dried. The process parameters for each heat treatment are shown in Table 2.
After undergoing QPQ treatment and oxidation, the surface of the samples appeared black, while after chrome plating it was silver and bright, and after ion nitriding it was silver gray.
Table 1 Sample No. of Different Heat Treatment
| Sample category | QPQ processing | Oxidation | Chrome plating | Ion nitriding |
| Metallographic specimen | al | – | – | dl |
| Wear test specimen | a2 | b2 | c2 | d2 |
| Corrosion resistance test sample | a3 | b3 | c3 | d3 |
Table 2 Process Parameters of Heat Treatment for 40Cr Steel
| Sample | Workmanship | Heat treatment process parameters |
| al,a2,a3 | QPQ processing | Preheating (360 ℃ × 30min)+nitriding (630 ℃ × 120min)+oxidation (380 ℃ × 30min) |
| b2,b3 | oxidation | Tank solution (NaOH: NaNO2=2:1), oxidation (140C × 20min) |
| c2,c3 | Chrome plating | Bath solution (CrO3: 250g/L+H2SO4: 3g/L), chromium plating (55C × 50A/dm2) |
| d1,d2,d3 | Ion nitriding | Glow plasma nitriding (520 ℃ × 20h) |
Grind the metallographic specimens (a1, d1) that have undergone various heat treatment processes with fine sandpaper until they are shiny. This is done for metallographic inspection and hardness measurement.
After the metallographic inlay, measure the hardness gradient from the surface of the infiltrated layer to the matrix.
The microhardness tester used in the test has a test force of 0.098 N (10 gf) and a holding time of 10 seconds.
Corrode the prepared metallographic sample with a 4% nitric acid and alcohol solution. After the sample has been dried, observe its structure using a 4XB metallographic microscope.
The M-2000A ring block wear tester is used to perform sliding wear tests on wear samples (a2, b2, c2, d2) that have undergone various heat treatment processes.
The friction pair is a GCr15 steel test ring with a hardness of 57 HRC. The ring has an outer diameter of 40 mm, a rotating speed of 200 r/min, a load of 100 N, and a total wear time of 30 minutes.
To prepare the worn sample, clean both the front and back of the sample repeatedly with acetone, and then dry it. Measure the weight loss of the sample using an electro-optical analytical balance that has an accuracy of 0.1 mg.
Revised version:
Conduct a neutral salt spray test on samples (a3, b3, c3, d3) with different heat treatment processes using the KD60 salt spray tester, in accordance with GB/T10125.
The corrosion medium used for the test is a saline solution with 5% NaCl and a pH value of 6.7.
The temperature inside the test chamber is set to 35°C, the nozzle pressure is 83 kPa, and the observation period is 24 hours.
The intermittent spray time is 8 hours, and the stop time is 16 hours.
Table 3 shows the hardness distribution of 40Cr steel after different processes.
As shown in Table 3, after undergoing QPQ, ion nitriding, and chromium plating, the surface hardness reaches 711 HV, 525 HV, and 703 HV, respectively. The hardness gradient gradually decreases from the surface to the substrate.
It is not possible to measure the hardness of the sample after oxidation treatment because the oxidation film is very thin. There is no oxide film present on the surface of the sample after it has been polished with fine sandpaper.
Table 3 Microhardness Test Results
| Distance from surface/um | 0 | 100 | 200 | 300 | 400 | 500 |
| Surface hardness of ion nitriding HV | 525 | 462 | 375 | 310 | 274 | 274 |
| QPQ surface hardness HV | 711 | 303 | 300 | 274 | 273 | 270 |
| Chromium plated surface hardness HV | 703 | 274 | 274 | 273 | 274 | 273 |
| Oxidation surface hardness HV | – | 274 | 274 | 274 | 273 | 274 |
Figure 1a and 1b show the metallographic photos of 40Cr steel after ion nitriding and QPQ treatment, respectively.
There is no need to examine the metallography of the sample after chromium plating and oxidation treatment. The coating structure of the sample after chromium plating is pure chromium, and the surface after oxidation is a very thin black Fe3O4 oxide film.
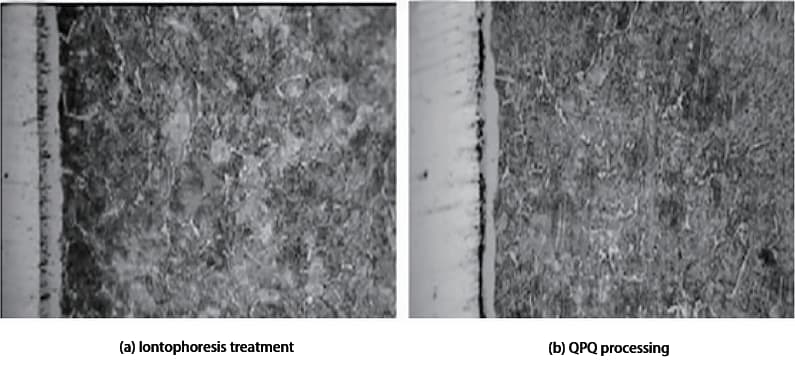
Fig. 1 Metallographic Structure of 40Cr Treated by Different Processes
As seen in Figure 1, the nitriding layer of both the QPQ and ion nitriding treatments is composed of a compound layer and a diffusion layer, with the white band in the figure representing the compound layer.
In the case of the QPQ treatment, the amount of oxide layer on the surface is too large to be observed under the metallographic microscope.
Despite the ion nitriding treatment time being seven times longer than the QPQ treatment, the thickness of the formed compound layer is roughly half that of the QPQ treatment’s compound layer.
In terms of the homogeneity of the compound layer, Figure 1 shows that the structure of the nitrided layer after QPQ treatment is more uniform, while the structure of the sample after ion nitriding is less uniform.
Table 4 compares the wear values of samples treated by different processes under the wear test conditions described.
As seen in Table 4, the wear value of the sample treated by QPQ in the 30-minute test is at least 1.9 mg.
The wear resistance of the QPQ treated sample is 1.45 times greater than that of the chromium plated sample, 4.32 times greater than that of the ion nitrided sample, and 7.9 times greater than that of the oxidized sample.
It is clear that the wear resistance of the QPQ treated samples has significantly improved.
Table 4 Comparison of Wear Values of Sliding Wear Test
| Serial No | Processing method | Hardness HV | Wear value/mg | Relative wear ratio |
| 1 | QPQ processing | 711 | 1.9 | 1 |
| 2 | Chrome plating | 703 | 2.75 | 1.45 |
| 3 | Ion nitriding | 525 | 8.2 | 4.32 |
| 4 | Oxidation | – | 15 | 7.9 |
Table 5 shows the results of the neutral salt spray test on samples treated by different processes under the corrosion resistance test conditions described.
As seen in Table 5, the salt spray corrosion resistance of the 40Cr steel sample treated by QPQ is 3.2 times greater than that of the chromium plated sample, 8 times greater than that of the ion nitrided sample, and 32 times greater than that of the oxidized sample.
This demonstrates that the corrosion resistance of steel parts after QPQ treatment has significantly improved.
Table 5 Comparison of Corrosion Resistance of Neutral Salt Spray Test
| Serial No | processing method | Rust start time/h | Comparison of relative corrosion resistance |
| 1 | QPQ processing | 256 | 1 |
| 2 | Chrome plating | 80 | 0.31 |
| 3 | Ion nitriding | 32 | 0.13 |
| 4 | Oxidation | 8 | 0.03 |
In the QPQ treatment process, the surface of 40Cr steel forms a high concentration of Fe2~3N nitride layer and a dense Fe3O4 oxide film. This type of compound layer has high hardness and wear resistance, but the binding strength of the chromium plating layer is not strong enough.
During the sliding wear test, the chromium plating layer is prone to peeling, resulting in lower wear resistance compared to the QPQ treatment. However, the wear resistance of the chromium plating is better than the low nitrogen alloy structure on the surface after ion nitriding.
The surface after oxidation only has a thin Fe3O4 oxide film, which has low hardness and only provides anti-corrosion properties.
The high corrosion resistance of the sample after QPQ treatment is mainly due to the high corrosion-resistant Fe2~3N compound layer and the dense oxide film on the surface. The oxygen can penetrate into the deeper compound layer, further passivating it and providing higher corrosion resistance to the surface.
(1) The QPQ treatment of 40Cr steel results in the formation of a high concentration of Fe2 ~ 3N nitride and a dense Fe3O4 oxide film on its surface, which greatly improves its surface microhardness, wear resistance, and corrosion resistance.
(2) The wear resistance and corrosion resistance of the 40Cr steel surface decreases in the order of QPQ, chromium plating, ion nitriding, and oxidation treatment.

