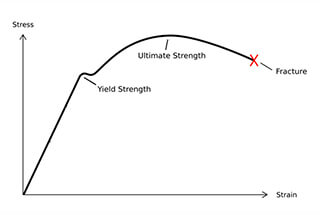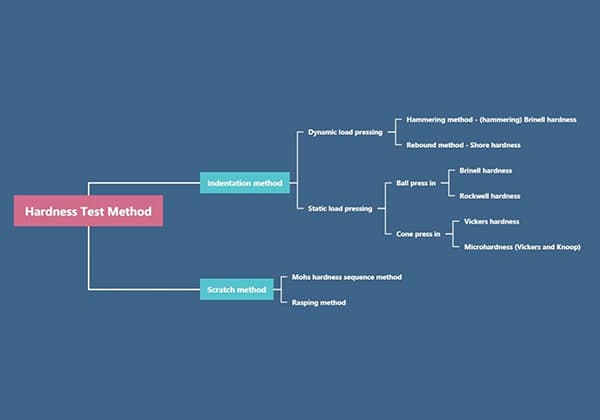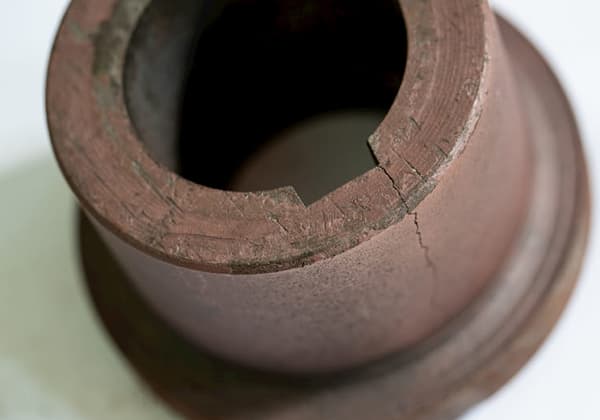
Imagine standing on a bridge, watching a heavy truck pass by. Ever wondered why the bridge doesn’t collapse under the weight? This article dives into the concepts of strain and stress, explaining how materials deform under force and how engineers calculate these deformations to ensure safety. You’ll learn the fundamental relationships between these forces, how they are measured, and their practical implications in everyday structures. Whether you’re a budding engineer or just curious, this guide will shed light on the unseen forces that keep our world intact.
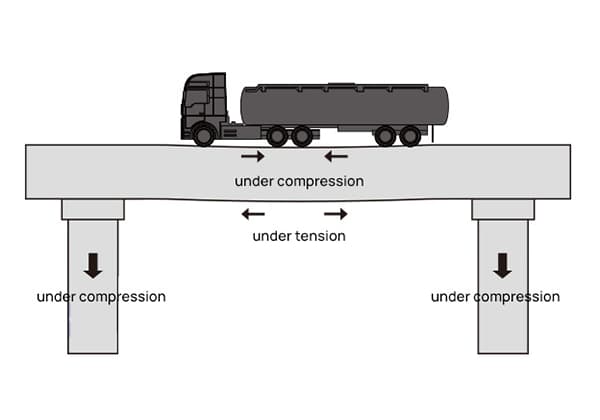

First, the majority of the safety monitoring industry is to measure the deformation of the structure being tested. Too much deformation may cause accidents.
For example, cracks in structures, sinking, and displacement between the structure and a fixed reference, these are large deformations that can be seen with the naked eye, and can be measured in millimeters using gauges such as crack gauges, static levels, and displacement gauges.
But how can the small deformation caused by compression inside the structure being tested or bending outside the beam-shaped object be represented?
The answer is strain.

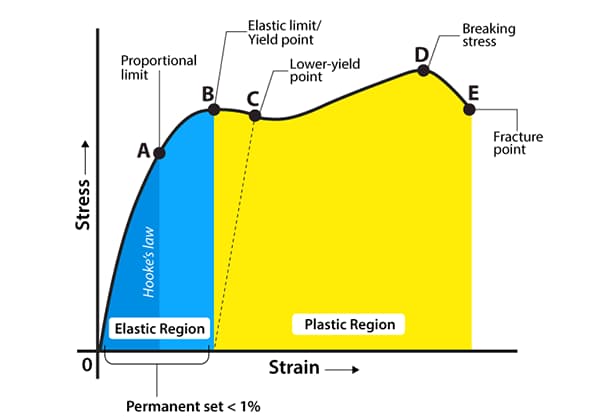
Suppose the length of a structure with length L undergoes deformation under stress and its length changes to L’, then its change in length ΔL = L’ – L, and the strain ε is the ratio of the change in length ΔL to the original length L, the formula is as follows:

So, what is the unit of strain?
As can be seen from the formula, strain is a ratio and is dimensionless, meaning it has no unit.
So, what is microstrain?
Because ΔL is very small, usually in the micron range, the calculated strain value is very small, with many decimal places, making it inconvenient to display and view, so the scientific notation 10-6 is introduced, called microstrain με, which can be understood as the unit of microstrain is 10-6, and our strain gauge measurement range is ±1500 microstrains, positive indicating stretching, and negative indicating compression.
Strain is a small deformation inside the structure being tested, so why does it deform? Because it is subjected to external force.
Taking a bridge pier as an example, if a fully loaded truck drives on the bridge, the pier will bear additional pressure and produce compression and compression strain, while the pier will produce an internal force to counteract the external force and overcome the deformation.
This internal force is stress. Stress is defined as the force per unit area, which is actually pressure, with units of MPa.
So, what is the relationship between the strain variable and the change in stress that is endured? Please see the calculation formula:

In the formula, σ represents stress, E is the elastic modulus of the material being tested, also known as Young’s modulus, which is a physical quantity that describes the elasticity of the material.
It can be seen as the material’s ability to resist deformation (rigidity), and from a micro perspective, it is the bond strength between atoms and molecules.
Two materials with the same deformation (the same strain value), the material with a higher resistance to deformation (a larger elastic modulus) will bear a larger stress.
For example, the same size tofu and iron block, if their height is compressed by 1mm, the former only needs to be gently pressed by hand, while the latter must be aided by a tool.
The elastic modulus of common engineering materials can be found in tables, such as the elastic modulus of C30 concrete is 30000MPa (1N/mm2 = 1MPa), and the elastic modulus of carbon steel is 206GPa.
The elastic modulus Ec of concrete under compression and tension should be adopted according to Table 4.1.5.
The shear deformation modulus Gc of concrete can be adopted at 40% of the corresponding elastic modulus value.
The Poisson’s ratio Vc of concrete can be adopted at 0.2.
Table4.15 Concrete Elastic Modulus (×104N/mm2).
| Concrete strength grade | C15 | C20 | C25 | C30 | C35 | C40 | C45 | C50 | C55 | C60 | C65 | C70 | C75 | C80 |
| Ec | 2.20 | 2.55 | 2.80 | 3.00 | 3.15 | 3.25 | 3.35 | 3.45 | 3.55 | 3.60 | 3.65 | 3.70 | 3.75 | 3.80 |
Note:
1. When reliable test data is available, the elastic modulus can be determined based on actual measured data;
2. When a large amount of mineral admixtures are added to concrete, the elastic modulus can be determined based on actual measured data according to the specified age.
Table 1.1-13 Elastic Modulus and Poisson’s Ratio of Commonly Used Materials
| Item | Elastic modulus E/GPa | Shear modulus G/GPa | Poisson’s ratio μ | Item | Elastic modulus E/GPa | Shear modulus G/GPa | Teflon |
| Gray cast iron | 118~126 | 44.3 | 0.3 | Rolled zinc | 82 | 31.4 | 0.27 |
| Nodular cast iron | 173 | 0.3 | Lead | 16 | 6.8 | 0.42 | |
| Carbon steel, nickel chromium steel | 206 | 79.4 | 0.3 | Glass | 55 | 1.96 | 0.25 |
| Alloy steel | Organic glass | 2.35-29.42 | |||||
| Cast steel | 202 | 0.3 | Rubber | 0.0078 | 0.47 | ||
| Rolled pure copper | 108 | 39.2 | 0.31-0.34 | Bakelite | 1.96-2.94 | 0.69-2.06 | 0.35-0.38 |
| Cold drawn pure copper | 127 | 48.0 | Sandwich phenolic plastic | 3.92-8.83 | |||
| Rolled phosphor tin bronze | 113 | 41.2 | 0.32-0.35 | Celluloid | 1.71-1.89 | 0.69-0.98 | 0.4 |
| Cold drawn brass | 89-97 | 34.3-36.3 | 0.32-0.42 | Nylon 1010 | 1.07 | ||
| Rolled manganese bronze | 108 | 39.2 | 0.35 | Unplasticized polyvinyl chloride | 3.14-3.92 | 0.35-0.38 | |
| Rolled aluminum | 68 | 25.5-26.5 | 0.32-0.36 | teflon | 1.14-1.42 | ||
| Drawn aluminum wire | 69 | Low pressure polyethylene | 0.54-0.75 | ||||
| Cast aluminum bronze | 103 | 41.1 | 0.3 | High pressure polyethylene | 0.147-0.245 | ||
| Cast tin bronze | 103 | 0.3 | concrete | 13.73~39.2 | |||
| Duralumin alloy | 70 | 26.5 | 0.3 | 4.9-15.69 | 0.1-0.18 |
After all, when internal stresses cannot be measured directly, stress can be calculated by measuring strain and then multiplying it by the material’s modulus of ela

